Poland
- Country
- Region
- Return Rates
- Age
- Gender
- Education
- Labour Market
- Occupations
- Employment
- Area of Residence
- Contact
Based on previous research, one can conclude that until now Poland has experienced already three phases of return migration. ‘The first phase lasted till 1938, and involves traditional return migration, which were the result of mass economic emigration of Poles to the United States in 1919-1938 (Chałasiński 1936, Niemyska 1936, Walaszek, 1983). In the communist period (1945-1989) the migration system was dominated by emigration. Statistical data show that out of more than 3 million emigrants only 55,000 returned in the years 1961-1989, which is the second phase. Political and other emigrants that left Poland before 1990 and came back since then constitute the third and current phase of return migration’ (Klagge/Klein-Hitpaß 2007: 8).
Poland has been a typical emigration country until 1989. Since then, its migration situation has changed, and Poland can nowadays be characterized as an emigration-immigration country (see Korys/Weinar 2005). Since the opening of the borders, large numbers of Poles and their foreign-born children (second generation of Poles) as well as immigrants from other Western and Eastern European countries entered. Especially interesting is here, that the number of highly-skilled immigrants is fairly large. Poland’s accession to the European Union in 2004 was again a trigger for many Polish emigrants to return - but, in addition, also many especially young and well-educated Poles left Poland to live and work in England or Ireland (see Klagge/Klein-Hitpaß 2007: 8).
According to the Polish Population Census conducted in 2002, which provides detailed information on returning migrants, 69,700 Polish nationals, half of them female, have returned to Poland in the period 1989-2002.
According to the PPC, highly-skilled returnees mainly come from the U.S. (17.6%), Germany (15.9%), Great Britain (7.5%), France (5.7%) and Canada (4.9%). The majority of them are at age of economic activity – 90% of them are between 25-59 years old, less than 10% is at retirement age (data, see Klagge/Klein-Hitpaß 2007: 12).
Klagge and Klein-Hitpaß (2007) also highlight the high educational level of Polish returnees:
‘In comparison to the Polish population as well as to polish emigrants, adult return migrants are relatively well educated. 27% of them hold the highest educational degree (university degree); while this percentage is as low as 14% in the adult Polish population and 10% among adult Polish emigrants (Central Statistical Office)’ (Klagge/Klein-Hitpaß 2007: 9).
Most of the highly-skilled returnees are employees. ‘Almost 90% of them work in the service sector and the vast majority represent professions such as high-ranking officials, managers and specialists. In comparison with other return migrants those with a university degree are strongly overrepresented in these positions, but have a lower level of self-employment’ (Klagge/Klein-Hitpaß 2007: 12). Only 13% are self-employed without employees and 9% employ other people (Klagge/Klein-Hitpaß 2007: 12). Interestingly, out of 69,700 returnees, 28% left Poland again before 2002. But the people who left were generally lower skilled than those returnees who decided to stay and live in Poland also after 2002 (see Klagge/Klein-Hitpaß 2007: 9).
Grabowska-Lusinska (2010) analysed the career patterns of returnees on the basis of an ethno-survey (N=406). The results show that approx. 8% of the returnees could enhance their career after return, but the majority of the respondents state that either nothing has changed in terms of their career path or that the experience of migration has even enhanced the fragmentation of their career (Grabowska-Lusinska 2010).
Budnik (2007), doing research on potential polish emigrants, found that ‘the propensity to emigrate for unemployed people is significantly higher than the propensity to emigrate of employed or workers out of the labour market’ (Budnik 2007: 6). Her findings are validated by a report on the objective and subjective quality of life in Poland (Social Diagnosis 2005), which states that over 20% of unemployed were interested in working abroad. Budnik (2007) further analysed the situation of polish returnees and found that ‘return migrants had around three times higher probability of finding a job after a return to the source country than unemployed or non-participants. If the return migrants were positively selected or they were able to accumulate a job relevant human capital abroad, an increase of emigration after 2004 might be seen as a factor reinforcing labour market activity foremost of those who would otherwise find it hard to enter employment’ (Budnik 2007: 14f).
Interestingly, research by Heffner/Sołdra-Gwiżdż (1997) showed that returnees are rather heterogeneous in terms of their educational level according to their previous place of residence. German return migrants with dual Polish-German citizenship ‘were on average, less educated and did not have special qualifications before or after returning to Poland. Despite this fact, upon return many of them would start their own businesses. The main reason for their return is their failure in the receiving country related to economical and integration problems. They mostly return to places from which they left, what shows that they maintain strong ties with the sending region’ (Klagge/Klein-Hitpaß 2007: 14). The authors argue that these results do not reflect the general situation of returnees in Poland.
Polish social scientists (Weinar 2002, Górny/Osipovic 2006) have conducted several qualitative interviews with polish returnees. The most important finding from their research is that the main motivation to come back to Poland goes beyond economic reasons and the returnees’ own economic well-being. Most of them state that they want to contribute actively to the economic, social and political development in Poland – thus making them potential innovation actors with respect to local and regional development (Klagge/ Klein-Hitpaß 2007: 13, 15).
The qualitative studies also revealed that the majority of the interviewed returnees intend to stay in Poland (Iglicka 2002). Of course, some returnees state that they were disappointed with the political and economic situation of the country and thus decided to emigrate again. ‘In a study on return migration of second-generation British Poles, Górny and Osipovič (2006) showed (…) that at the beginning of the 1990s (many of them) took part in recreating the country’s economy, thus realizing their ideological reason of return. After 1993, when a post-communist government began to rule and the situation on the labour market had started to deteriorate (increasing unemployment), they lost their faith in the possibility to support Poland’s development’ and thus went back to Britain (Klagge/Klein-Hitpaß 2007: 14).
Literature:
Budnik, K. (2007): Migration Flows and Labour market in Poland. National Bank of Poland. Working Paper No. 44.
Chałasiński, J. (1936): Emigracja jako zjawisko społeczne’ (Emigration as a social phenomenon), Przegląd Polonijny, 4: 495-501.
Górny, A. and Osipovič, D. (2006): Return migration of second-generation British Poles. CMR Working Papers No 6/64, Warsaw: UW, (http://www.migracje.uw.edu.pl/obm/pix/006_64.pdf)
Grabowska-Lusinska, I. (2010): People on the move. Return Migration to Poland. Presentation on the European Job Mobility Day, Brussels, 16th Nov. 2010.
Heffner, K. and Sołdra-Gwiżdż, T. (1997): Migracje powrotne na Górny Śląsk z socjologicznej perspektywy (Return migration to Upper Silesia from a sociological perspective). CMR Working Papers Nr 9, Warsaw: UW (http://www.migracje.uw.edu.pl/obm/pix/009.pdf)
Iglicka, K. (ed) (2002): Migracje powrotne Polaków. Powroty sukcesu czy rozczarowania? (Poles’ return migrations. Return of success or disappointment?). Warsaw: Institute of Public Affairs.
Klagge, B. and Klein-Hitpaß, K. (2007): High-skilled return migration and knowledge-based economic development in regional perspective. Conceptual considerations and the example of Poland. Centre of Migration Research No. 19/77.
Koryś, P. and Weinar, A. (2005): Immigration as a Labour Market Strategy: Poland’, in Niiessen, J. and Schibel, Y. (ed) Immigration as a Labour market strategy – European and North American Perspectives. Migration Policy Group, Brussels, 1-31.
Niemyska, M. (1936): Wychodźcy po powrocie do kraju (Re-emigrants after return to the country), Warszawa: Instytut Gospodarstwa Społecznego.
Walaszek, A. (1983): Reemigracja ze Stanów Zjednoczonych do Polski po I wojnie światowej. (Return migration from USA to Poland after first world war). Zeszyty Naukowe Uniwersytetu Jagiellońskiego DCLV. Prace Polonijne, Zeszyt 7. Warszawa-Kraków: PWN.
Weinar, A. (2002): Reemigranci jako aktorzy zmiany społecznej (Re-emigrants as actors of social change), Warsaw: Institute of Public Affairs, 39-76.
| Basic data | |
|---|---|
| Population in the case study region | 1 266 400 |
| Total Area (sq.km) | 11 711,20 |
| GDP per capita in the region | 2,6 |
| Net Migration Rate | - 5-7 % |
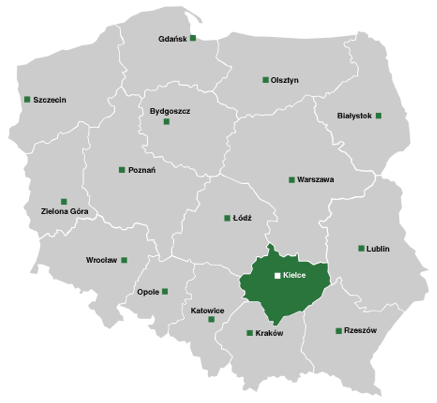
The region of Swietokrzyskie lies to the Southeast of Lodz, the second Polish case study (see above). It is a young province, created only in 1999, and has around 1.67 Mio inhabitants. The study states a share of national GDP of only 2.6%. Data, which is not quoted in a stringent way indicates a young population with a median age of only 37.3 years (2008). The population decreased by 1.3% over the last 6 years. There was a sharp decrease in the youngest age group (-15) from 22.7 to 16.9 in the period from 2006 to 2010, but no decrease in the job entrance group (15-24), and an increase in all the other groups. Though the data is not complete there seems to be an aging tendency but starting from a very low median age. Qualification level is low, with more than 50% (53.9%) having less than upper secondary education and only 12.5% having tertiary education.
Employment by sectors shows almost half of the work force (48.2%) in the primary sector, 22.1 in the secondary and only 11.2 and 18.5 in the tertiary and quaternary sectors. Industries are in traditional sectors like mining, construction industry, metal and metallurgy, energy and chemicals and, important and growing, agricultural products. There is an initiative to redevelop the old Polish Basin which used to be a leading region starting from the 15th century. In contrast to the heavy industry, almost 70% of the landscape is naturally protected, offering touristic possibilities.
Swietokrzyskie is neighbouring Warsaw, Lodz, Silesia and Krakow, offering market approach and education facilities in close proximity, but also competition from much more dynamic regions. The region is not directly linked to trans-European road networks and has no centres. This is also a major disadvantage for investment from abroad. The Province is thus collaborating with the provinces neighbouring to the Southeast to create common development strategies.
Migration Balance in the Świętokrzyskie Voivodeship in the Year 2008.
| Migration Balance | Year 2007 | Year 2007 |
|---|---|---|
| Balance of the inter-province migrations | -2629 | -2016 |
| Balance of the international migrations | -287 | -317 |
uring the last 6 years more than 106.000 people left the province and only a few hundred returned. This increasingly constitutes a problem for Polish companies who want to recruit qualified personnel. Already in 2007, the Polish Confederation of Private Employers (PKPP) thus appealed to the Government to find counter-measures and a programme called ‘Coming Home’ was initiated, consisting of 6 packages to support re-migration. Emigration is mainly caused by lack of work places, low wages offered and a lack of qualified jobs (in relation to education levels) causing a brain drain of better qualified people. Motivation to return home, on the contrary, is mainly caused by family ties.
District labour offices try to offer alternatives to migration to mitigate the trend, and they support individuals in their job search as well as employers in their strategies to attract workers, using all kinds of active labour market instruments including individual consulting, trainings and supporting the validation of the achieved vocational qualifications. A regional action plan for employment was implemented in 2009/2010 inviting also other regional stakeholders to join and agree on a comprehensive strategy supporting the labour market.
Further measures include:
- an information campaign established by the region named ”Zielona Linia” (Green Line, www.zielonalinia.gov.pl) providing vital information connected with the support returning migrants can expect to receive when coming back;
- education measures to support the children of returned migrants.
| Basic data | |
|---|---|
| Population in the case study region | 2 534 357 (2010 r.) |
| Total Area (sq.km) | 18 218,96 |
| GDP per capita in the region | 93,1% the national average |
| Net Migration Rate | -23 person (2010 r.), -108 person (2009 r.) |
The Lodz Region in the centre of Poland with more than 2.5 Mio inhabitants is by far the biggest case study within Re-Turn. The geographic location in proximity of all major Polish cities and the fairly big capital city Lodz with 768 000 inhabitants should provide the basis for economic prosperity. In spite of this GDP is only 93% of national average and investment is low. Regarding the structure of economic activity half of the employees are engaged in the tertiary sector and 30% in the secondary sector. The share of the primary sector is rather high at almost 20%, decreasing at a slower rate than in Poland in general. For the service sector it is postulated that there is no specific section that would have the potential to lead regional development (also tourism ranks low). The regional industry is based, above all, on textile and clothing and is not technology driven. The share of the chemical sector is 40% higher than national average due to restructuring during the transition period.
In contrast to many other European regions and to all other case study regions, there is no aging trend to be observed (a slight reduction of 15-24 and a slight increase of 25-44). Data provided for education attainment is not conclusive. The overall activity rate for the region and across all age groups is 55.9% and increasing, with a strong bias in favour of men (65% to 47.9% for women). The lowest activity rates are for 55+ with only 18% and 15-24 with 36.4%. Emigration doubled in just two years following the EU accession and the opening of labour markets, respectively.
Return policies are supported by the district labour offices which support the matching process of entrepreneurial demand and job seekers, including returnees. This is also done with the assistance of intermediary agencies and covers job search but also activation and training.
Share of nationals and non-nationals among immigrants, 2009, data source: EUROSTAT, own calculations
| nationals | non-nationals | |
|---|---|---|
| 0.75 | 0.25 |
Immigration by nationals includes both returning migrants and citizens born abroad who are immigrating for the first time.
Age structure of recent returnees (1 year upon their arrival) and stayers in LFS 2005-2008, weighted data
| returnees | stayers | |
|---|---|---|
| 14 and younger | 2.52 | 11.82 |
| 15-29 years | 48.74 | 24.45 |
| 30-39 years | 24.37 | 14.53 |
| 40-49 years | 12.61 | 14.77 |
| 50-64 years | 9.24 | 20.15 |
| 65 and older | 2.52 | 14.28 |
Using the Labour Force Survey it is possible to identify recent return migrants using the retrospective information on the country of residence one year before the survey and the country of birth.
Generally, recent returnees are younger than stayers.
Recent returnees (1 year upon their arrival) according to gender, in %, LFS 2008-2008, weighted data
| returnees | stayers | |
|---|---|---|
| male | 60.00 | 47.97 |
| female | 40.00 | 52.03 |
Using the Labour Force Survey it is possible to identify recent return migrants using the retrospective information on the country of residence one year before the survey and the country of birth.
In Poland, about 40% of the recent returnees are female and about 60% are male.
Educational attainment of recent returnees (1 year upon their arrival), aged 17-62, compared to that of stayers, LFS 2005-2008, weighted data
| returnees | stayers | |
|---|---|---|
| low | 6.14 | 20.72 |
| medium | 71.05 | 64.04 |
| high | 22.81 | 15.24 |
low=up until lower secondary level, middle=upper secondary level, high=tertiary level
In Poland, 23% of recent returnees are highly-skilled, 71% are medium-skilled and 6% are low-skilled. Among the stayers 15% are highly-skilled, 64% are medium-skilled and 21% are low-skilled.
Labour market status of recent returnees (1 year upon arrival), aged 17-62, compared that of stayers, LFS 2005-2008, weighted data
| returnees | stayers | |
|---|---|---|
| employed | 52.63 | 55.88 |
| unemployed | 21.05 | 7.79 |
| inactive | 26.32 | 36.33 |
Using the Labour Force Survey it is possible to identify recent return migrants using the retrospective information on the country of residence one year before the survey and the country of birth.
In Poland, 53% of recent returnees are employed, 21% are unemployed and 26% are inactive. 56% of the stayers are employed, 8% are unemployed and about 36% are inactive on the labour market.
Occupations of recent returnees (1 years upon arrival), aged 17-62, compared to those of stayers, LFS 2005-2008, weighted data
| returnees | stayers | |
|---|---|---|
| managers and professionals | 15.79 | 21.54 |
| technicans and associate professions | 8.77 | 11.12 |
| intermediate occupations | 71.93 | 59.55 |
| elemantary occupations | 3.51 | 7.79 |
"managers and professionals"=ISCO100-ISCO200; "technicans"=300; "intermediate occupations"=ISCO400-ISCO800; "elementary occupations"=ISCO900
In Poland, 16% of recent returnees are managers and professionals, 9% are technicans, 72% are employed in intermediate occupations and 4% are employed in elementary occupations.
Recent returnees (1 year upon arrival), aged 17-62, and stayers according to sectors of employment, LFS 2005-2008, weighted data
| returnees | stayers | |
|---|---|---|
| Agriculture | 17.14 | 15.15 |
| Industry | 37.14 | 30.40 |
| Services | 45.71 | 54.45 |
Using the Labour Force Survey it is possible to identify recent return migrants using the retrospective information on the country of residence one year before the survey and the country of birth.
In Poland, 46% of recent returnees are employed in the service-sector.
Recent returnees (1 year upon arrival), aged 17-62, and stayers according to the area of residence, LFS 2005-2008, weighted data
| returnees | stayers | |
|---|---|---|
| densely populated area | 50.56 | 41.67 |
| intermediate area | 13.48 | 12.90 |
| thinly populated area | 35.96 | 45.43 |
Using the Labour Force Survey it is possible to identify recent return migrants using the retrospective information on the country of residence one year before the survey and the country of birth.
In Poland, 51% of the recent returnees (1 year upon arrival) live in densely populated areas.
Department of Regional Policy
Marshal Office of the Swietokrzyskie Voivodship
Sienkiewicza Str. 6325-002;
Kielce
Mariusz Kowalski
Tel. + 48 041 365 81 84
E-mail: Mariusz.Kowalski@sejmik.kielce.pl
The results and conclusions are those of the authors and not those of Eurostat or the European Commission
This project is implemented through the CENTRAL EUROPE Programme co-financed by the ERDF.